Smart Meter Data Basics
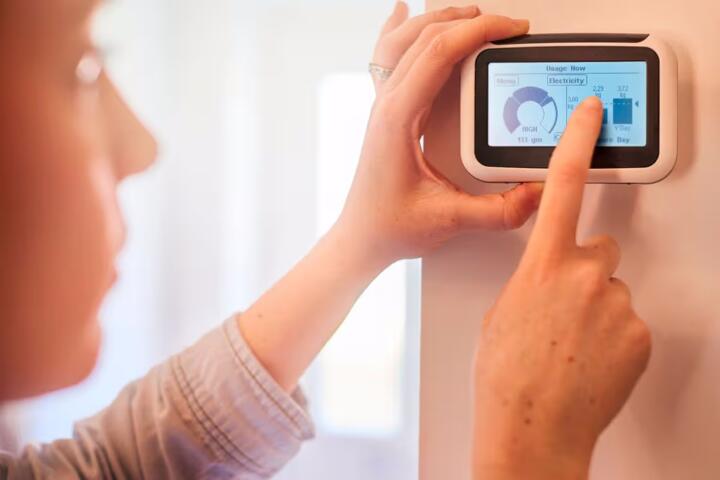
Smart meters measure energy use in intervals such as 15 minutes, 30 minutes, or hourly, then transmit those readings to the utility. The meter itself stores a history locally, while the utility collects and processes the data for billing and customer portals. Homeowners usually see a simplified view: daily totals, monthly totals, and sometimes downloadable interval files.
For electricity, the data often includes kWh per interval, meter status flags, and sometimes separate channels for supply and generation. For gas, interval data may be derived from pulse counts and temperature or pressure compensation, depending on local metering rules. If your home has solar, a smart meter may show both import (grid use) and export (solar generation sent back to the grid), which can confuse people who expect only one number.
Practical examples help. If your portal shows a sudden spike on a day when you were away, the interval file can reveal whether the spike lasted one interval or persisted for hours. If your bill rises but your daily totals look flat, the issue may be in rate schedules, demand charges, or meter-to-bill mapping rather than actual consumption.
Common Misreads And Gaps
Homeowners often treat the portal chart as the raw truth, even though utilities may smooth, aggregate, or correct data before displaying it. Interval data can also be missing during communications outages, then backfilled later. A chart that updates weeks later can reflect late data arrival, not a new consumption event.
Another frequent mistake is comparing the portal’s “usage” to the bill without checking the billing period boundaries. Bills rarely align perfectly with calendar months, and some utilities use time-of-use rate periods that depend on local definitions of peak and off-peak hours. If your plan has seasonal time-of-use rules, the same kWh pattern can produce different charges.
Supporting technologies shape what you see. Smart meters rely on a communications network (often cellular, radio mesh, or power-line communications), and the utility’s head-end system processes messages into billing-ready records. Meter firmware versions and data quality checks can affect which fields appear in downloads; I’ve seen portals that expose “v1” interval formats one year and “v2” the next, with column names changing while the underlying kWh values remain consistent.
Privacy expectations also get blurred. Smart meter data is not the same as appliance-level monitoring, but fine-grained intervals can still reveal patterns such as occupancy rhythms. Access controls vary by jurisdiction and utility policy, so a homeowner’s ability to download raw data may depend on account settings, identity verification, and the utility’s data retention period.
What To Check In Your Data
Verify Time Zones And Billing Windows
Start by matching the portal’s interval timestamps to the billing period on your bill. Check whether the timestamps are in local time or UTC, and whether daylight saving time shifts appear as 23- or 25-hour days. If your download includes a “timezone” field or a header note, record it. When the portal uses local time but the bill uses a different convention, you can see a mismatch even when the meter is accurate.
A realistic outcome: after aligning the date ranges, many “my usage doesn’t match my bill” complaints shrink to a rate-calculation issue rather than a meter problem. If the mismatch persists, look for missing intervals or a data correction note in the portal.
Inspect Interval Files For Gaps
If your utility offers a CSV or similar download, scan for missing intervals, repeated timestamps, or long runs of zeros. A single zero interval can happen when an appliance cycles off, but a block of missing data often shows as blank rows, “N/A,” or a reduced number of intervals for that day. For electricity, also check whether the file includes separate channels such as import and export; export-only days can occur with solar homes.
Tools help without being fancy. A spreadsheet can count intervals per day, and a simple script in Python or even Excel pivot tables can flag days with fewer than the expected number of intervals. I once compared a 15-minute dataset and found one week with 92 intervals per day instead of 96, which traced back to a communications outage that the portal chart later smoothed.
Compare kWh Totals To Bill Line Items
Do not compare only the total kWh; compare the bill’s structure. Many bills include energy charges, delivery charges, taxes, and sometimes demand charges based on the highest usage during specific windows. If your plan uses time-of-use rates, compare kWh by peak and off-peak hours rather than by day totals. Some utilities also apply “metered” versus “estimated” reads, and the bill may blend both.
When you do the comparison, use the same units. If the bill lists therms or m³ for gas, convert carefully using the utility’s stated conversion method if you want to reconcile with kWh-equivalent values. If the portal download is in kWh but the bill uses therms, the mismatch is expected.
Check Meter Health And Status Flags
Some portals expose meter status indicators such as communication quality, tamper events, or power-loss events. If you see a tamper or reset flag near the dates of unusual usage, document the timestamp and compare it to the interval file. If the portal does not show flags, request a data quality report from the utility’s support channel.
A mild frustration is common here: many customer portals show charts but hide the underlying flags. Still, the utility can often provide a summary of data quality for a billing period, and that summary can narrow the investigation quickly.
Educational Case Examples
Case: Solar Export Looks Like “Negative Use”
A homeowner with rooftop solar sees the portal show negative daily totals on some days. The bill includes both energy charges for import and credits for export, so the net number on the chart does not match the bill’s “import kWh” line. The interval file reveals that import dropped to near zero during daylight, while export rose during the same intervals. After comparing import kWh to the bill and export kWh to the credit line, the homeowner confirms the meter data aligns with charges.
Case: Missing Intervals During Travel
A household reports a higher bill while they were away. The portal chart shows a smooth curve, but the downloaded interval file shows a gap of several hours on two days and a reduced interval count for the week. The utility later backfilled corrected data, and the bill recalculated after the correction. The homeowner avoids repeating the complaint by saving the interval file and noting the portal’s “last updated” date.
Checklist And Comparison Table
The goal is decision support: decide whether the issue is data quality, rate calculation, or something else before contacting support.
| Check | What You Look For | Likely Cause | Next Step |
|---|---|---|---|
| Time alignment | Billing dates match interval timestamps | Boundary mismatch or timezone/DST shift | Reconcile using the bill’s exact start/end dates |
| Interval gaps | Missing or reduced interval counts | Communications outage or delayed backfill | Download again after portal updates; request data quality notes |
| Import vs export | Separate channels reconcile to bill lines | Net chart hides import/export components | Compare import kWh to energy charges and export to credits |
| Rate windows | Peak/off-peak kWh match TOU rules | TOU schedule or seasonal definitions differ | Break down kWh by TOU windows, not just by day |
| Status flags | Tamper/reset/communication quality indicators | Meter event or data quality correction | Document timestamps; ask utility for the event summary |
Step-by-step checklist you can follow in one sitting:
- Download the interval file for the same date range as the bill, then save it with a date-stamped filename.
- Count intervals per day and flag any day with fewer intervals than expected for your interval size.
- Sum import kWh (and export kWh if present) for the bill period and compare to the bill’s metered lines.
- Break kWh into peak/off-peak windows if your plan uses time-of-use rates.
- Check portal notes for “last updated” dates or correction notices, then repeat the download if the portal changed.
- If anomalies remain, contact the utility with the exact timestamps and the interval-file evidence.
Common Mistakes To Avoid
One mistake is relying on a single chart view without downloading the underlying data. Charts can hide missing intervals, and some portals round values, which makes reconciliation harder. Another mistake is assuming that “estimated” reads never appear on smart meter accounts; utilities can still estimate during communications failures, then correct later.
People also misread negative values. In solar homes, negative net usage can mean export credits, not a meter fault. If you treat net values as consumption, you can misdiagnose the cause of a bill change.
Finally, avoid sending vague messages to support. “My bill is wrong” rarely leads to a fast resolution. A better message includes the bill number, the date range, the interval size, and the specific timestamps where the data looks inconsistent. If you have a spreadsheet summary, attach it; utilities often respond faster when the request includes concrete evidence.
FAQ
What interval size should I expect?
Many electricity smart meters record 15-minute or 30-minute intervals, while some regions use hourly. Your utility’s download format or portal settings usually state the interval size; if it does not, count the number of intervals per day in the file.
Why does my portal chart change after a bill?
Utilities can backfill delayed meter communications, apply data quality corrections, or update how they aggregate intervals for display. Save the interval file and note the portal “last updated” date so you can compare versions.
How can I tell if missing data caused my bill?
Compare the number of intervals in the downloaded file to the expected count for the interval size. If a day has fewer intervals, the bill may have used partial data or estimates for that period.
Do smart meters reveal appliance-level details?
Interval data can show usage patterns, but it does not automatically identify specific appliances. Appliance-level inference requires additional analysis and often higher-resolution data than many portals expose.
Can I request my raw smart meter data?
Many utilities provide downloads through customer accounts, while others require a formal request. Availability depends on local rules, utility policy, and data retention; check your portal first, then ask support about raw interval exports and retention dates.
Author's Insight
Smart meter data sits at the intersection of measurement, communications, and billing logic. Homeowners get the most reliable answers by reconciling interval files to bill line items using the same date boundaries and rate windows. Data quality issues usually show up as missing intervals, delayed backfills, or status flags tied to specific timestamps.
Because utilities vary in portal formats and correction practices, the safest approach uses evidence you can download and compare. If you cannot reconcile after aligning time zones, billing windows, and import/export channels, a utility data quality review is the next step rather than guessing at appliance causes.
Key Takeaways
- Match interval timestamps to the bill’s exact date range and watch for timezone and daylight saving time effects.
- Use downloaded interval files to check for missing intervals and delayed backfills, not just portal charts.
- Compare import and export channels separately when solar is involved, and reconcile to the bill’s specific line items.
- When you contact support, include bill identifiers and timestamp-level evidence so the review targets the right data window.